ROC curves and imbalanced datasets
When dealing with imbalanced datasets it can be tempting to take the usual approach and judge a classifier by its area under the ROC curve (ROC-AUC). However we can get an almost perfect (=1) ROC-AUC for a classifier and still miss some crucial aspects of the classifiers limitations.
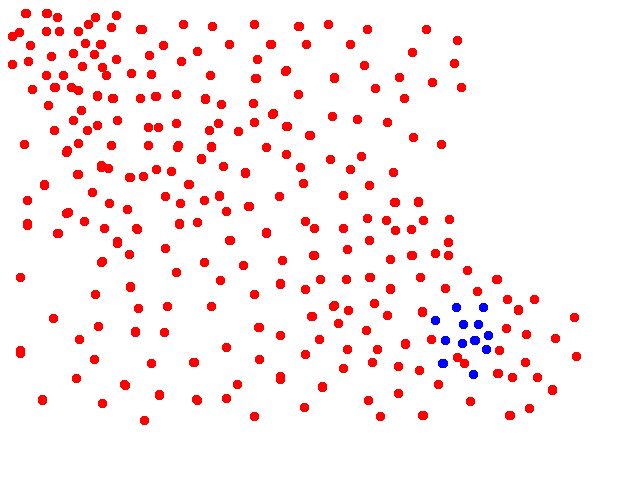
Let’s take a look at the dataset in the figure below. Blue dots represent the positive class and red dots the negative class. We can assume that we are doing binary classification using logistic regression.
The threshold in our classifier can be set to different values resulting in, for example, the two different boundaries shown in the following figure.
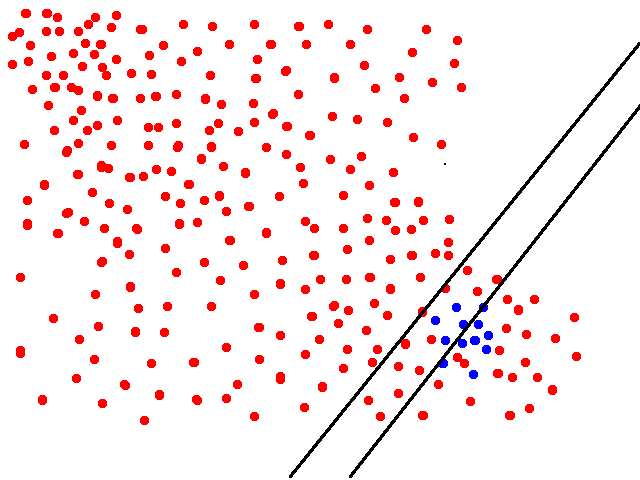
In the rightmost classifier the True Positive Rate or recall ($TPR= \dfrac{TP}{P}=\dfrac{TP}{TP+FN}$) is ca. 0.5 but our False Positive Rate ($FPR = \dfrac{FP}{N}=\dfrac{FP}{FP+TN}$) is very low (<0.1). The classifier to the left already has TPR of 1.0 but still a very low FPR (<0.2) - and for both of these classifiers we can let the FPR approach 0 as we add more negative points in the upper-left corner.
If we would increase the threshold (which would result in boundaries to the left of the two boundaries shown) we would get classifiers on with TPR=1 but increasing FPR. This would give use the flat line on the top of the ROC curve.
All in all we see that by changing the threshold we would get a great result when measured by the ROC-AUC (close to 1). However this metric completely misses the fact that all of those classifiers are extremely poor when it comes to precision.
So we should keep in mind that in this setting it would be neccessary to look at the precision recall curve.