Diversity Maximization
Finding a diverse set of points in a metric space is a problem that comes up in many different areas. Let’s say you want to find an optimal locations for a restaurant chain or return a diverse set of search results in a search engine or pick the most diverse dataset to train your model.
These are all examples of diversity maximization (also called dispersion problem) and essentially it’s about arranging/picking points as far away from each other as possible.
I recently read an interesting(but quite old) paper on this problem Ravi et al.
Quantitative Perspective
When approaching diversity maximization, we must first decide on a function for quanitfying diversity to be able to maximize that particular function. Two examples of diversity objectives are:
MAX-MIN: maximizing the minimum distance between any pair of data points.
MAX-AVG: maximizing the average distance between all pairs of data points.
In [Ravi et al] it is noted that for both diversity functions (max-min and max-avg) the problem is NP-hard, even when the distances satisfy the triangle inequality.
Furthermore the paper provides a greedy heuristic which is a near-optimal solution to the max-min and max-avg problem and they show that for the max-min problem the following holds: unless P = NP, no polynomial- time heuristic can provide a better performance guarantee.
The details of the heuristic can be seen in the image below.
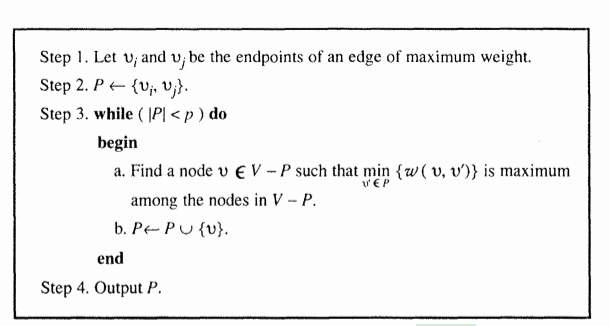
In the algorithm $V$ is the set of all points and $v_1$, $v_2$ $\in$ $V$. The set $P$ is the set of points chosen by the algorithm to maximize the minimum distance between any pair of data points. The function $w(v,v’)$ is simply the distance metric.
Here the “endpoints of an edge of maximum weight” refers to the pair of points in the set of points where the pairwise distance is the maximum among all pairs of points.
Example code
Let’s code up this algorithm and quickly see how it works:
import random
import math
from scipy.spatial import distance_matrix
import numpy as np
import matplotlib.pyplot as plt
def heuristic_sampling(input_features, num_samples):
    dist_matrix = distance_matrix(input_features, input_features)
    N = len(input_features)
    # Start by finding the two points v1,v2 which farthest from each other.
    # in [Ravi et al] this are the points referred to as " endpoints of an edge of maximum weight. "
    # where the weight is simply the distance.
    v1,v2 = np.unravel_index(np.argmax(dist_matrix, axis=None), dist_matrix.shape)

    # V is the index of all points
    V = set(range(0, N))
    # P is the set of selected sample points
    P = set([v1,v2])
    V_not_P = V-P

    for _ in range(num_samples):
        # dist_to_points keeps track of the distance to each point in P, from all other points.
        dist_to_points = dist_matrix[:, list(P)]
        # min_dist is a 1d numpy array
        # and keeps track of the minimum distance for each point to all possible points
        min_dist = dist_to_points.min(axis=1)

        max_of_min = 0
        max_of_min_index = -1
        for index, distance in enumerate(min_dist):
            if index not in P and distance>max_of_min:
                max_of_min = distance
                max_of_min_index = index
        P.add(max_of_min_index)
    return P
Let’s start off by generating a set of random points on the unit circle - this is corresponds to the set $V$ above.
def random_point_on_unit_circle(N):
    random_vec = []
    # random angle
    for _ in range(N):
        angle = 2 * math.pi * random.random()
        # random radius
        r = math.sqrt(random.random())
        # calculating coordinates
        x = r * math.cos(angle)
        y = r * math.sin(angle)
        random_vec.append([x, y])
    return np.asarray(random_vec)
random_circle_points = random_point_on_unit_circle(1000)
Next we pick some points in $V$ which maximizes diversity according to max-min using the greedy heuristic above, this corresponds to the set $P$ above.
ravi_sample_points = heuristic_sampling(random_circle_points, 5)
fig = plt.figure()
ax1 = fig.add_subplot(111)

ax1.scatter(random_circle_points[:,0],random_circle_points[:,1], s=10, c='r', marker="o")
ax1.scatter(random_circle_points[list(ravi_sample_points),0], random_circle_points[list(ravi_sample_points),1], s=10, c='b', marker="s")
plt.show()
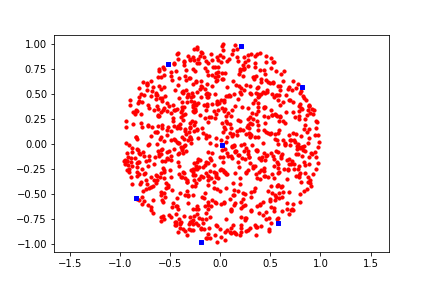
On the figure we see that the blue points (picked by the greedy algorithm) are indeed far apart! Mission accomplished.